I found this very interesting website called "Your Weight On Other Worlds." All you have to do is enter your current weight and click "Calculate," and the website will tell you how much you would weigh on the Moon, Mars, the Sun, and many more. You weigh more or less on different worlds because of the difference in their gravitational pulls. Since the Moon has a weaker gravitational pull than the Earth does, you would weigh less there than you do here. Similarly, since the Sun has a stronger gravitational pull than the Earth does, you would weigh more there than you do here (Source: http://wonderopolis.org/wonder/how-much-do-you-weigh-on-the-moon/).
Click here to visit this website!
Thursday, March 27, 2014
Shapes on Polar Coordinate Systems
When graphing on a polar graph, you can generate some very interesting shapes. Some of these include limaçons, rose curves, circles, and lemniscates.
Limaçons:
r = a ± b cosθ
r = a ± b sinθ
(0 < a, 0 < b)
Rose curves (if n is odd, there will be n "petals"; if n is even, there will be 2n "petals"):
r = a cos(nθ)
r = a sin(nθ)
(n ≥ 2)
Circles:
r = a cosθ
r = a sinθ
Lemniscates:
r2 = a2 sin(2θ)
r2 = a2 cos(2θ)
Here are some specific pictures (from our book) of these graphs:
Polar Coordinate System
This week, we learned about a new system of graphing. Originally, we used the rectangular graphing system, but now we can use the polar graphing system.
On a rectangular graph, a point is defined by (x, y). To reach this point, you must travel x units to the right and y units up. No point can be defined by two different ordered pairs; for example, the point (1, 6) can only be defined by (1, 6).
On a polar graph, a point is defined by (r, θ). To reach this point, you must travel r units in the direction of θ radians. This means that a point can be defined by multiple different ordered pairs; for example, the point (2, π) can also be defined by (-2, 0). This is because traveling 2 units in the direction π is the same as traveling 2 units backwards from the direction 0 or 2π.
To convert from polar to rectangular coordinates, use the following equations:
x = r cosθ
y = r sinθ
To convert from rectangular to polar coordinates, use the following equations:
tanθ = y / x
r2 = x2 + y2
Next, we will learn about graphing lines on polar graphs!
Thursday, March 20, 2014
Sierpinski Triangle
The Sierpinski Triangle is a very interesting fractal shape. It is an equilateral triangle that contains an infinite number of progressively smaller equilateral triangles. Since it is a fractal, you can zoom into this shape infinitely and never reach the "end," because every time you get closer, more triangles appear around the already existing ones. Here is a video of a Sierpinski Triangle being zoomed into. Enjoy!
Rotations of Conic Sections
Rotating conic sections, such as ellipses, circles, parabolas, or hyperbolas, is most easily done by rotating the axis on which they lie instead. The angle at which the axis is rotated is represented by theta (θ).
The angle θ can be determined by using the following equation:
cot(2θ) = (A – C) / B
The values of x and y can be determined by the following equations:
x = x'cosθ – y'sinθ
y = x'sinθ + y'cosθ
After substituting the value of θ into these equations, the x and y values are determined, and can be substituted into the original equation. Doing so and simplifying should eliminate the xy term, resulting in an equation that can be used to graph the ellipse, circle, parabola, or hyperbola on the rotated axis.
The rotated axis can be created by drawing a set of x and y axes at the angle θ counterclockwise from the original set of x and y axes.
Normally, this process is very complicated at first, especially at the step where you must simplify. If there is still an xy term after you simplify, this is an easy method of seeing that you have done something wrong. If there is not this xy term, simplifying further should make the equation much smaller and easier to read.
Finally, all you have to do is draw the ellipse, circle, parabola, or hyperbola on the rotated axis just as you would draw it on a regular axis!
Hyperbolas
Earlier this week, we learned about hyperbolas. Hyperbolas look like two parabolas facing opposite directions. Here are the equations for the two types of hyperbolas:
 The best way to explain hyperbolas would be with an example, so here is the equation of an example we will walk through:

Already, we know that the equation above represents a vertical hyperbola because the y term precedes the x term.
The center of a hyperbola is given by (h, k), but in the equation above, there is neither an h nor a k, so we will set them to 0, making the center (0, 0).
The vertices of a hyperbola are found by adding and subtracting a from the dominant term in the ordered pair of the center. In this case, the dominant term is the y term, which is 0. This gives us the vertices (0, 5) and (0, -5) because the square root of 25 is 5.
The foci are found by adding and subtracting c from the dominant term in the ordered pair of the center, which is the y term again. The value of c squared is the sum of a squared and b squared. After doing this calculation, we find that c = 13 for this particular equation. This gives us the foci (0, 13) and (0, -13).
Finally, we must find the asymptotes. We will use the formulas m = b/a and m = -b/a, where m is the slope. Doing this gives us the asymptotes y = ±(5/12)x.
Now, we have finished finding the information for this hyperbola and can graph it!
Thursday, March 13, 2014
Calculating Pi Using Pies
In honor of Pi day, which is tomorrow, I found a great video showing a few people trying to calculate pi using actual pies! As we all know, pi is equal to the circumference of a circle divided by its diameter. By counting the number of pies placed on the circumference of a chalk circle and dividing it by the number of pies placed on the diameter of the same circle, the people in the video got a number extremely close to the actual value of pi!
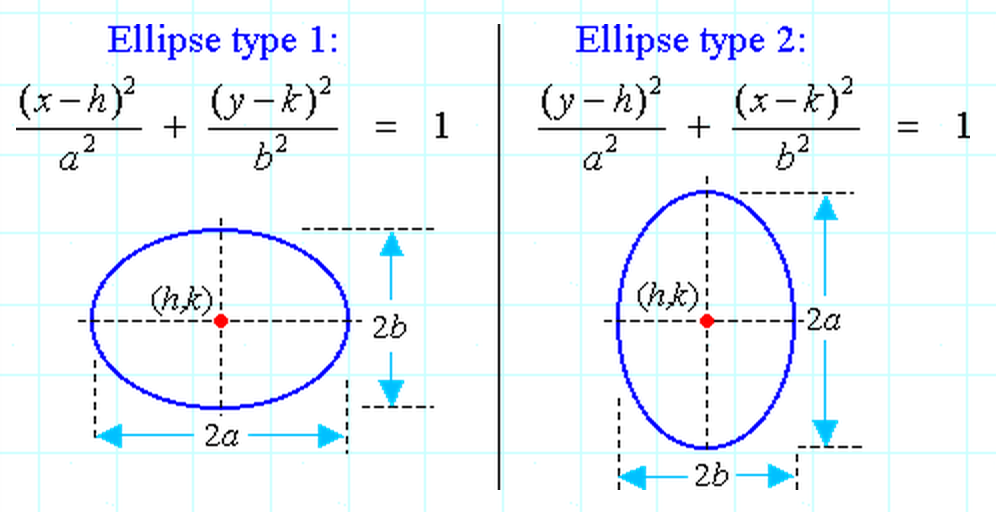
Ellipses
Today, we learned about ellipses. Like parabolas, the two types of ellipses are horizontal and vertical. Here are the equations for these (in this image, Ellipse type 1 refers to a horizontal ellipse while Ellipse type 2 refers to a vertical ellipse):
Two additional values we can determine are c and e.
The value of c is the distance between a focus and the center of the ellipse. It can be calculated using the following equation:
c2 = a2 – b2
The value of e is the eccentricity of the ellipse, or a measure of how oval it is. It can be calculated using the following equation:
e = c / a
On http://www.purplemath.com/modules/ellipse2.htm, I found a great practice problem that I will demonstrate. It asks, "State the center, vertices, foci and eccentricity of the ellipse with the general equation 16x2 + 25y2 = 400."
We should start by putting this equation in the same format as seen in the image above. Since the only difference between the two equations is the switching of a and b, and since we only determine a as being the constant in the denominator greater than that of the other denominator, we can choose either equation. I will choose the first one:
Dividing both sides by 400 and simplifying yields:
(x2 / 25) + (y2 / 16) = 1
Now, we see that the denominator under x is greater than that under y, so we know that a is the square root of the number under x. This gives us:
a = 5
b = 4
We can already determine the center of the ellipse, which is given by (h, k). Looking back at the equation in the image above, we see that h and k are found in the numerators, and because
x2 = (x – h)2 if x = 0
and
y2 = (y – k)2 if y = 0,
we know that h = 0 and that k = 0, making the center of the ellipse (0, 0).
To determine the vertices, we add and subtract a from the value of the center that is the numerator of a. In this case, this value is 0. This gives us the vertices (5, 0) and (-5, 0).
To determine the foci, we add and subtract c from the value of the center that is the numerator of a.
Again, this value is 0. We determine c using the equation presented earlier, which gives us:
c2 = a2 – b2
c2 = 25 – 16
c2 = 9
c = 3
This gives us the foci (3, 0) and (-3, 0).
Now, all we need to determine is the eccentricity, which is given by c / a:
e = c / a
e = 3 / 5
We have finally finished finding the center, vertices, foci, and eccentricity of this ellipse!
Parabolas
This week, we learned about parabolas. There are two major types of parabolas: vertical and horizontal. Here are the equations for these parabolas:
| Vertical: | (x – h)2 = 4p(y – k) |
| Horizontal: | (y – k)2 = 4p(x – h) |
The vertex of the parabola is given by (h, k), and p is the distance from the vertex to the focus and also the distance from the vertex to the directrix.
Here is an example of a vertical parabola:
 Let us assume that h = 2 and k = 4, and focus = (2, 5).
In order to find p, we can use the fact the y-value of the focus is k + p. After substituting in k, we get the following equation:
4 + p = 5
p = 5 – 4
p = 1
That means that the vertex, directrix, focus, and equation would be the following:
Here is an example of a vertical parabola:
In order to find p, we can use the fact the y-value of the focus is k + p. After substituting in k, we get the following equation:
4 + p = 5
p = 5 – 4
p = 1
That means that the vertex, directrix, focus, and equation would be the following:
| Vertex: | (2, 4) |
| Directrix: | y = k – p = 4 – 1 = 3 |
| Focus: | (2, 5) |
| Equation: | (x – 2)2 = 4(y – 4) |
The next blog post will have information about ellipses!
Thursday, March 6, 2014
The Monty Hall Problem
While we were talking about probability in class, we started talking about the Monty Hall Problem. This probability problem has become famous because it is so counterintuitive. It involves a game show in which the contestant must determine which of three door conceals the grand prize. I do not want to give too much away, so I have included a great video that describes this problem and explains its outcomes. Enjoy!
Mean, Median, Mode, Standard Deviation, and Variance
When working with a set of numbers, measures of central tendency can be used to determine the average, middle, or most occurring numbers. Standard deviation and variance can also be calculated.

Suppose you have the following set of numbers:
4, 2, 7, 4, 3, 1, 8, 5, 6
To calculate the mean, or average, you must divide their sum by the number of numbers:
4 + 2 + 7 + 4 + 3 + 1 + 8 + 5 + 6 = 40
40 / 9 = 4.44
To find the median, you must place all of the numbers in order and find the number in the middle:
1, 2, 3, 4, 4, 5, 6, 7, 8
If there are two numbers in the middle, then the median will be their average; however, the median is only one number in this case.
To find the mode, you must determine which number occurs the most:
1 = 1x
2 = 1x
3 = 1x
4 = 2x
5 = 1x
6 = 1x
7 = 1x
8 = 1x
To find the standard deviation, you must use the following equation:
In this case, the standard deviation is 2.297.
To find the variance, you simply square the standard deviation, producing, in this case, 5.278.
Probability
Today we learned about probability. This is very useful when trying to determine the chance of an event occurring. The probability of an event E occurring is P(E). This can be calculated in different ways depending on the problem itself. Here is an example based on one I saw on http://www.mathsisfun.com/data/probability.html:
A person is rolling two dice and wants to determine the probability of rolling a double, in which the numbers on both dice are the same.
There are only 6 possible outcomes in which the dice are doubles:
{1, 1}, {2, 2}, {3, 3}, {4, 4}, {5, 5}, {6, 6}
The sample space, or set of all possible outcomes contains 36 possible outcomes:
{1, 1}, {1, 2}, {1, 3}, {1, 4}, . . . {6, 3}, {6, 4}, {6, 5}, {6, 6}
Therefore, the chance of rolling doubles is given by:
6 / 36 = 1 / 6 = 0.167 = 16.7%
The probability of any event occurring can only be within the range of 0-1. An event whose probability is 0, or 0%, is called impossible, while an event whose probability is 1, or 100%, is called certain.
An independent event is one whose outcome is not affected by those of other events. An example of this would be flipping a coin; the probability is always 1 / 2 = 0.5 = 50%.
A dependent event is one whose outcome is affected by those of other events. An example of this would be drawing cards from a deck. After the first card is drawn, there is one fewer card in the deck.
Subscribe to:
Comments (Atom)